From Brian at Alphatrtends
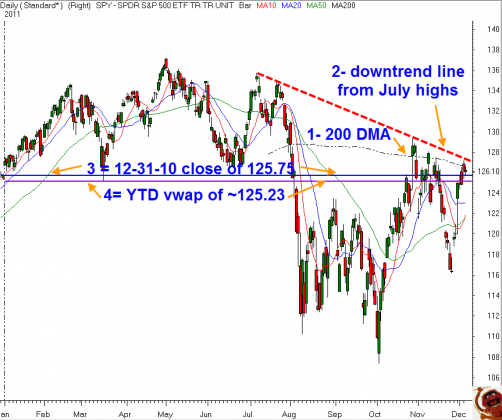
I would like to point out 4 significant technical levels on the daily chart of the $SPY in this general area. These levels are labeled 1-4 on the daily chart below.
Numbers 1 & 2 are generally considered bearish.
1- the declining 200 day moving average ~ 126.61
2- the downtrend line connecting the highs from midyear
1- the declining 200 day moving average ~ 126.61
2- the downtrend line connecting the highs from midyear
Numbers 3 & 4 are neutral to slightly bullish.
3- the blue horizontal line shows the closing price of 125.75 on 12/31/10
4- the purple horizontal line represents the Volume Weighted Average Price (VWAP) from the first trading day of the year through current prices ~ 125.23
3- the blue horizontal line shows the closing price of 125.75 on 12/31/10
4- the purple horizontal line represents the Volume Weighted Average Price (VWAP) from the first trading day of the year through current prices ~ 125.23
Looked at together and with a quick glance at the choppy price action, it remains difficult to have confidence in the near term direction of the market.
click charts to expand


No comments:
Post a Comment